STAR Housing Stats | January 2025
Published February 19, 2025 | Trisha Adams, STAR Communications Director

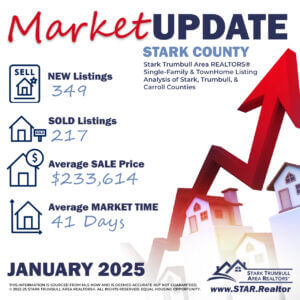
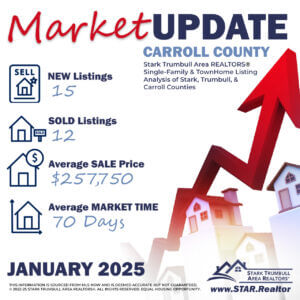
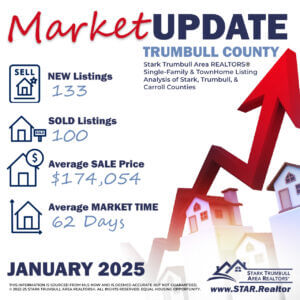
The STAR January Housing STATS are now available for you to review and/or share. The images below represent a Single-Family & TownHome Listing Analysis of Stark, Trumbull, & Carroll Counties.
According to the November Monthly Indicator Report published by MLS Now, February 11, 2025.
"U.S. existing-home sales advanced for the third straight month, climbing 2.2% to a seasonally adjusted annual rate of 4.24 million units, a 10-month high, according to the National Association of REALTORS® (NAR). Sales were up 9.3% year-over-year, driven largely by purchases of homes priced $500,000 and above. Month-over-month, sales rose in the South, Northeast, and the West but fell in the Midwest, with all four regions reporting year-over-year gains.
New Listings increased 5.5 percent for Single Family homes and 20.7 percent for Townhouse/Condo homes. Pending Sales decreased 14.7 percent for Single Family homes and 46.4 percent for Townhouse/Condo homes. Inventory increased 14.9 percent for Single Family homes and 71.1 percent for Townhouse/Condo homes.
Median Sales Price increased 20.3 percent to $192,500 for Single Family homes but decreased 17.5 percent to $185,500 for Townhouse/Condo homes. Days on Market remained flat for Single Family homes but increased 86.0 percent for Townhouse/Condo properties. Months Supply of Inventory increased 12.5 percent for Single Family homes and 56.3 percent for Townhouse/Condo homes.
According to NAR, total housing inventory was 1.15 million units heading into January, a 13.5% decrease from the previous month but a 16.2% increase from the same period one year earlier, for a 3.3-month supply at the current sales pace. Housing supply remains down compared to prepandemic levels, and the limited number of homes on the market continues to push sales prices higher nationwide, with the median existing-home price rising 6% year-over-year to $404,400." CLICK HERE to download the complete Monthly Indicator Report
Quick Facts
Residential activity in Carroll, Stark, and Trumbull counties combined composed of single family and townhouse/condo properties. Percent changes are calculated using rounded figures. Comparison January 2024 vs. January 2025.
| - 5.2% | + 17.5% | + 18.1% |
| Change in Closed Sales All Properties |
Change in Median Sales Price All Properties |
Change in Homes for Sale All Properties |
These statistics are sourced from MLS Now and were current as of February 11, 2025. They are deemed accurate, but not guaranteed.

STARK County Stats Sharable
CLICK HERE to download file

CARROLL County Stats Sharable
CLICK HERE to download file

TRUMBULL County Stats Sharable
CLICK HERE to download file
